To improve website loading speed, stop adding and start removing. The sites we ship load in a median of 0.6 seconds, and none of them got there with a plugin or a new hero image. They got there because the build strips out everything that stands between the visitor and the first paint, then refuses to let it back in.
TL;DR
- Most business sites take 7 to 8 seconds to show their main content. Google calls 2.5 seconds good and over 4 seconds poor.
- The median load time across the sites we ship is 0.6 seconds, and a release gate holds it there.
- The strip-out order runs page-builder debt, render-blocking CSS, un-budgeted scripts, then the server, then the hero image.
- Speed is a release gate: LCP under 2.0 seconds, CLS under 0.05, INP under 150 milliseconds.
Most business sites are slow, and the gap is wide
Our web development work starts from one published rule: no page builder, no un-budgeted script, and a performance budget enforced before anything deploys. That rule exists because the gap between a fast site and a typical one is wide, and most business sites sit on the slow side of it.
Two small studies from this month put numbers on it. SiteRefineAI tested 5,938 local business websites in October 2026, one mobile Lighthouse run each, and found a median of 7.6 seconds to show the main content.
Only 8 percent did it in 2.5 seconds or less, and 81 percent took more than 4 seconds. Curveball Creative Studio ran 239 independent business homepages through the same phone test in November 2026 and found a median of 7.7 seconds, with 16 of 239 under 2.5 seconds and 83 percent over 4 seconds. The typical homepage weighed 2.6 MB.
Both samples are small and local, and each site got one run, so they prove slow is normal. They do not prove a global average. The line they miss is Google's own: Largest Contentful Paint of 2.5 seconds or less counts as good, over 4 seconds counts as poor, and the target holds for at least 75 percent of real visits.
Our homepage publishes a 0.6 second median load time across the sites we ship, with Core Web Vitals at 99 out of 100. The rest of this post is the strip-out list that holds that number.
The gap shows up in behaviour. A visitor who waits 7 seconds for the main content usually leaves before the page finishes, and the next result gets the tap instead. Speed is the first thing a visitor experiences, and on a phone it is often the only thing they experience before they decide.
Read the LCP breakdown before you touch anything
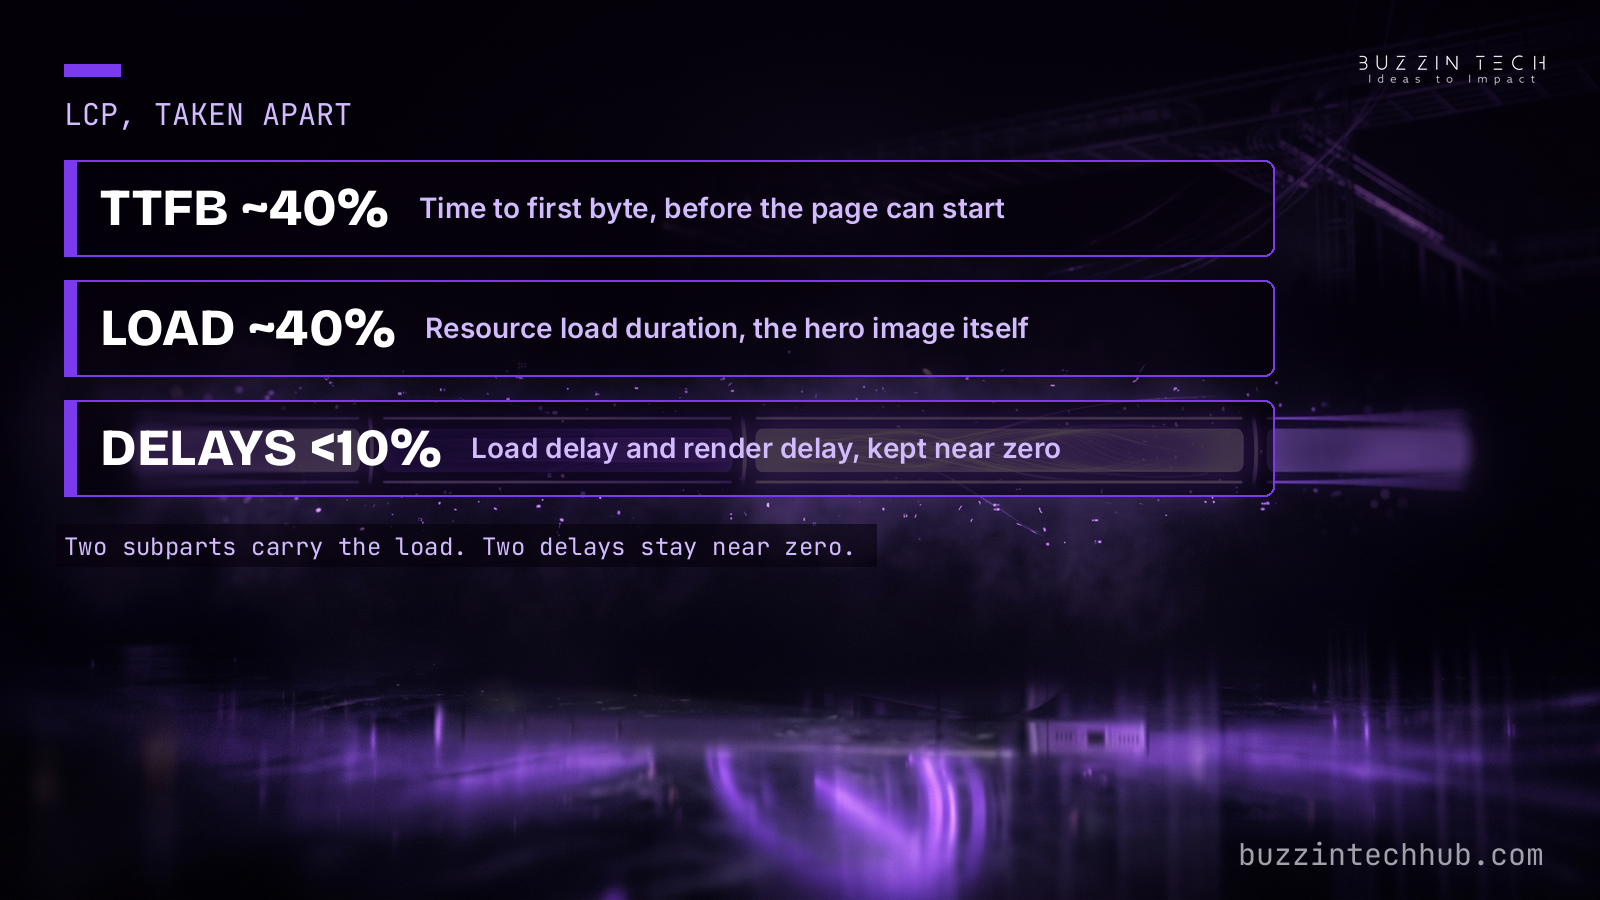
Largest Contentful Paint is the time from navigation to the moment the largest visible element renders. Google breaks it into four subparts, and the split decides where your fix belongs. Time to first byte takes about 40 percent of LCP, resource load delay takes under 10 percent, resource load duration takes about 40 percent, and element render delay takes under 10 percent.
The split matters because the most common first fix only touches one subpart. Compressing the hero image harder shrinks resource load duration, which is about 40 percent of the total.
If the failure sits in time to first byte, the image work changes nothing, and the time saved moves to another subpart. Diagnose first, then fix.
Start with field data. PageSpeed Insights shows what real visitors experience through the Chrome User Experience Report, and the lab section below it explains why.
A lab test on a fast office connection flatters a slow site. Our own builds are benchmarked on throttled 4G before launch, because that is the connection the visitor actually has.
The two delay subparts are the ones to watch. Resource load delay grows when the browser discovers the LCP element late, often because JavaScript manages it or a stylesheet blocks the render.
Element render delay grows when the element waits on JavaScript to finish before it can show. Both sit under 10 percent on a well-built page, and both point at code.
Strip the page builder first
Page builders are the first thing we remove. The reason is maintenance. Elementor, Divi, and WPBakery are convenient the week a site launches and a tax every week after.
Plugin stacks collide, themes buckle under real traffic, and backups take a weekend to restore. A hand-coded frontend carries none of that weight.
When we build, the frontend is written by hand, with components mapped from Figma tokens to production code. Nothing on the page arrives through a plugin the team did not choose, and nothing loads a script the page does not need. The result is a codebase the team can read, test, and change without fighting a builder's output.
This is the step most teams skip, because it looks like the expensive one. It is cheaper than the alternative.
A builder site that needs speed work later pays for the audit, the plugin surgery, and the rebuild anyway, usually under a deadline. Starting hand-coded skips the second build, and the site stays fast because nothing in it was ever built to be slow.
Cut render-blocking CSS and un-budgeted scripts
Every custom web build we ship carries zero render-blocking CSS. Stylesheets that block the first paint are split, inlined where they belong, or removed.
Scripts are deferred or removed, and minifying alone is not a fix. A smaller file that should not load at all still costs the same wait.
Third-party scripts get a budget. Every analytics tag, chat widget, and heatmap tool has a performance cost, and we measure it before it ships.
The ones that do not earn their weight get cut. A chat widget that adds half a second to first paint has to justify itself against the visitors who leave before it loads.
The rule is simple to enforce and easy to break. A marketing request adds a tag, the tag adds a script, and nobody measures the cost until the next audit.
Our builds keep the budget in the open, so a new script needs a number attached before it merges. That is what a budget means: a limit with a name on it, checked before the code ships.
Web fonts deserve their own line in the budget. A font loaded from another server holds the text back while the browser waits, and a page that swaps fonts mid-read shifts layout.
Our builds self-host fonts, preload the ones the first screen needs, and fall back to system fonts when the custom face is not ready. The text shows on time, and the layout stays still.
Fix the server before the hero image
Time to first byte is about 40 percent of LCP, so a slow server cannot be fixed downstream. Our builds serve server-rendered and edge-cached pages, so the first byte arrives fast and the browser starts work early. The data layer gets the same treatment: normalized schemas, zero-downtime migrations, and sub-15 millisecond query caching on PostgreSQL and Redis.
A site we rebuilt shows what the database layer can hide. Its database response times ran to 5 seconds under load, because unindexed queries scanned tables of more than 100,000 active records. Composite indexing cut query latency to under 5 milliseconds, and the site held 100 percent uptime through Black Friday.
The fix sat in the database. No amount of image compression would have found it.
The order of work follows from that. Profile the stack, benchmark Core Web Vitals, and read the query log before writing code. Our PostgreSQL 18 upgrade guide walks the same sequence for the database half of the stack, and it starts with the same rule: measure the slow queries before you tune anything.
The hero image, done properly
The hero image still matters, and it gets proper work. Format, sizing, and responsive variants come first, so a phone never downloads a desktop image.
Media is edge-cached, and the image the page needs first is the one the browser discovers first. Compression comes last in that list.
A high-volume store we rebuilt shows the full list in one place. Its mobile product pages loaded in 4 seconds, and the rebuild cut that to 0.75 seconds on mobile 4G. Heavy filter plugins went out and lightweight vanilla JavaScript filtering went in.
Initial script execution fell 65 percent. Product photography moved through an automated WebP pipeline that cut file weight by up to 70 percent with no visible loss. The store then handled 5,000 concurrent shoppers with no downtime, and checkout completion rose 27 percent.
The same pattern holds on quieter sites. A custom website we rebuilt loads in under 0.9 seconds on UK mobile connections, on a lightweight frontend with compressed WebP assets and edge delivery.
The lesson is the same in both cases: the image work sits after the server work and the script work, and it finishes the job instead of starting it. Our Flash Deals Mart case study tells the full rebuild in detail.
Make speed a release gate
None of this holds without a gate. Our builds carry automated Lighthouse budgets in CI: LCP under 2.0 seconds, CLS under 0.05, and INP under 150 milliseconds.
Those numbers sit above Google's own thresholds on purpose. Google's bar is the floor, and the build bar sits above it.
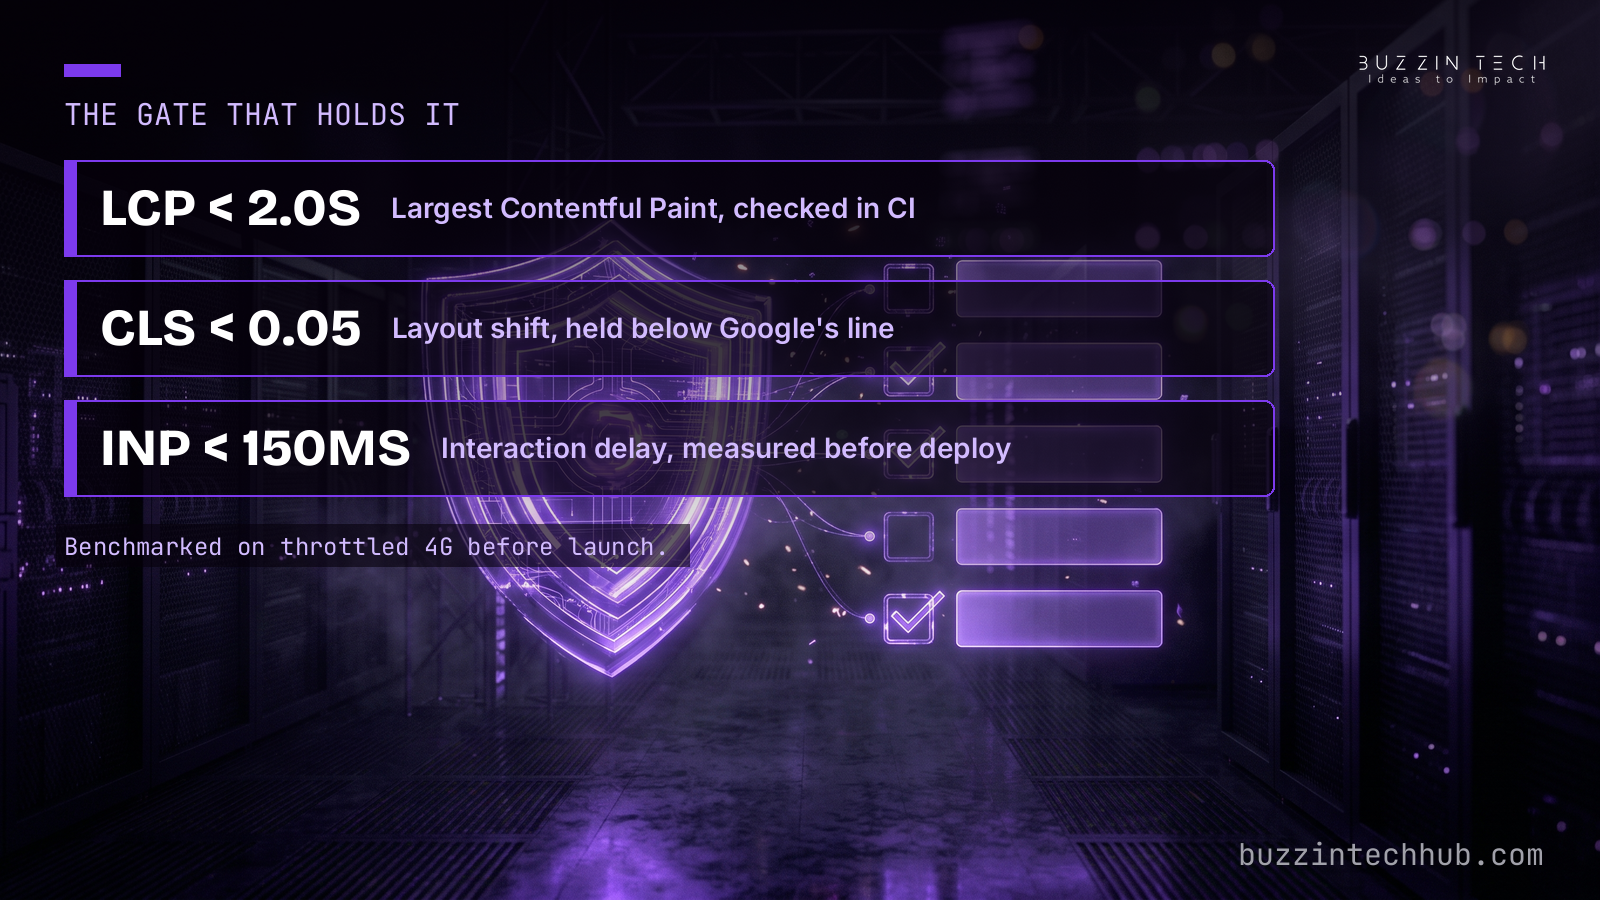
The gate runs before deploy. Every build is benchmarked on throttled 4G, and we do not close a project with a mobile PageSpeed score under 85.
The audit that opens the work sets the baseline: our first stage profiles the stack, crawls every URL, and benchmarks Core Web Vitals before any code. The speed pass that closes it runs Playwright end-to-end tests and a 90-plus PageSpeed validation.
The runtime underneath gets the same audit. Our Node.js 26 upgrade guide walks the sequence for the other half of the stack, and it starts with the same habit: list every runtime, test the move in staging, and watch the canary under real traffic before the full rollout.
Treat speed as a release condition and the strip-out list enforces itself. A script that breaks the budget fails the build, so it gets a decision instead of a quiet merge.
A hero image that pushes LCP past 2 seconds gets resized before launch, while the fix is still cheap. The sites we ship stay fast because the gate never moves, and the 0.6 second median is what a gate that never moves produces.
The gate does not stop at launch. Every build ships with 30 days of launch support, and most clients stay on a monthly retainer for the first 12 months, covering security patches, performance monitoring, dependency updates, and small feature work. Speed drifts when nobody watches it, so the retainer keeps the budget enforced after the launch post goes out.
Is your site the slow one in your market?
Most business sites take 7 seconds to show their main content on a phone. We run the audit that finds why yours does, then strip out what stands in the way.
See how we approach web development
Frequently asked questions
What is a good website load time?
Google counts Largest Contentful Paint of 2.5 seconds or less as good, for at least 75 percent of real visits, and over 4 seconds as poor. Our builds hold a stricter bar: LCP under 2.0 seconds in CI, and a 0.6 second median load time across the sites we ship. Anything under 2.5 seconds is good, and under a second is where a site stops losing visitors to the wait.
What slows a website down most?
Page builders and plugin stacks, render-blocking CSS, un-budgeted third-party scripts, and a slow server response. The order matters: the server and the scripts usually cost more than the images. Diagnose with the LCP subpart breakdown before you fix anything, so the work lands on the part that actually holds the page back.
How do you measure LCP correctly?
Start with field data from real visitors, through PageSpeed Insights or the Chrome User Experience Report, and read the 75th percentile. Lab scores come second: they show why a page is slow, but a lab test on a fast connection flatters a slow site. Measure on throttled 4G if you want the number your visitors actually see.
Does compressing images fix a slow site?
Only when the image is the bottleneck. Image compression shrinks resource load duration, about 40 percent of LCP. If time to first byte or load delay holds the page back, the image work changes nothing, so fix the server and the scripts first, then give the hero image proper format, sizing, and responsive variants.
What is a performance budget?
A set of limits a build must pass before it deploys: ours are LCP under 2.0 seconds, CLS under 0.05, and INP under 150 milliseconds, enforced in CI. A budget turns speed from a hope into a release condition. A script or image that breaks it fails the build, so it gets a decision instead of a quiet merge.
How long does a speed rebuild take?
It depends on what the audit finds: every engagement starts with a technical teardown that profiles the stack, crawls every URL, and benchmarks Core Web Vitals before any code. A site that needs a script and image pass moves in weeks, while a site that needs a rebuild gets a fixed scope, a timeline, and a staging build before anything goes live.